Logging progress and reading aim lines
Section outline
-
While a plan is active, log observations from the plan drawer: the date, the observed value (attendance rate, percentile, incident rate), and an optional note.
The aim line is the straight path from the starting value to the goal by the target date. Each observation plots against it:
- On aim — at or better than the line for that date: the intervention is on track.
- Below aim — consider intensifying (a higher tier or different strategy).
School-level rollups aggregate what you can see — active/completed counts, %-on-aim, %-met-goal by domain. Small groups may show as suppressed rather than a number: that is privacy protection working, never a zero.
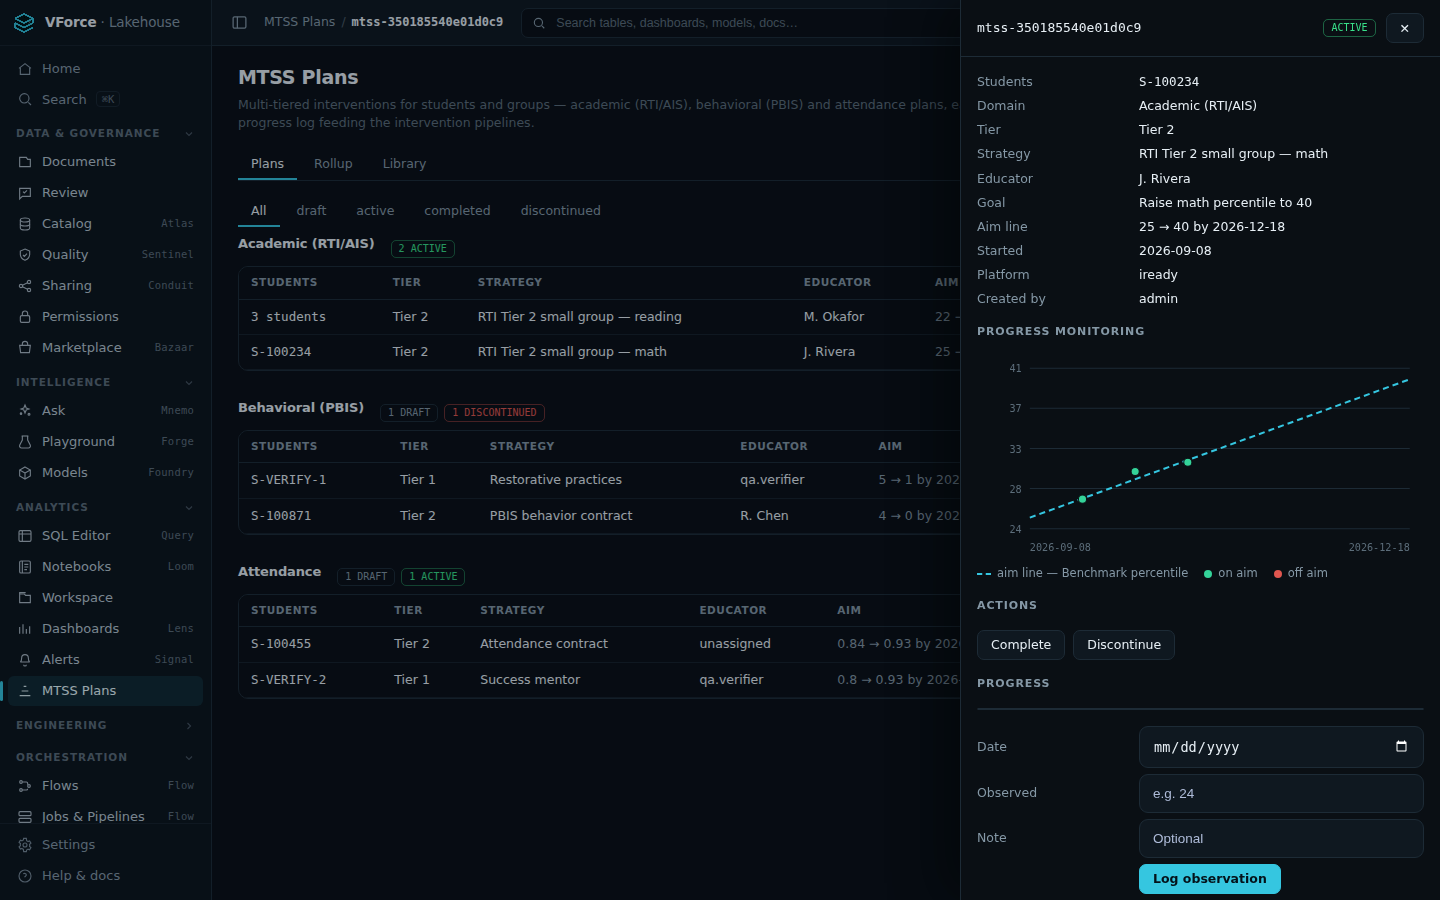
Observations plotted against the aim line — green dots are on aim — click the image to view full size. 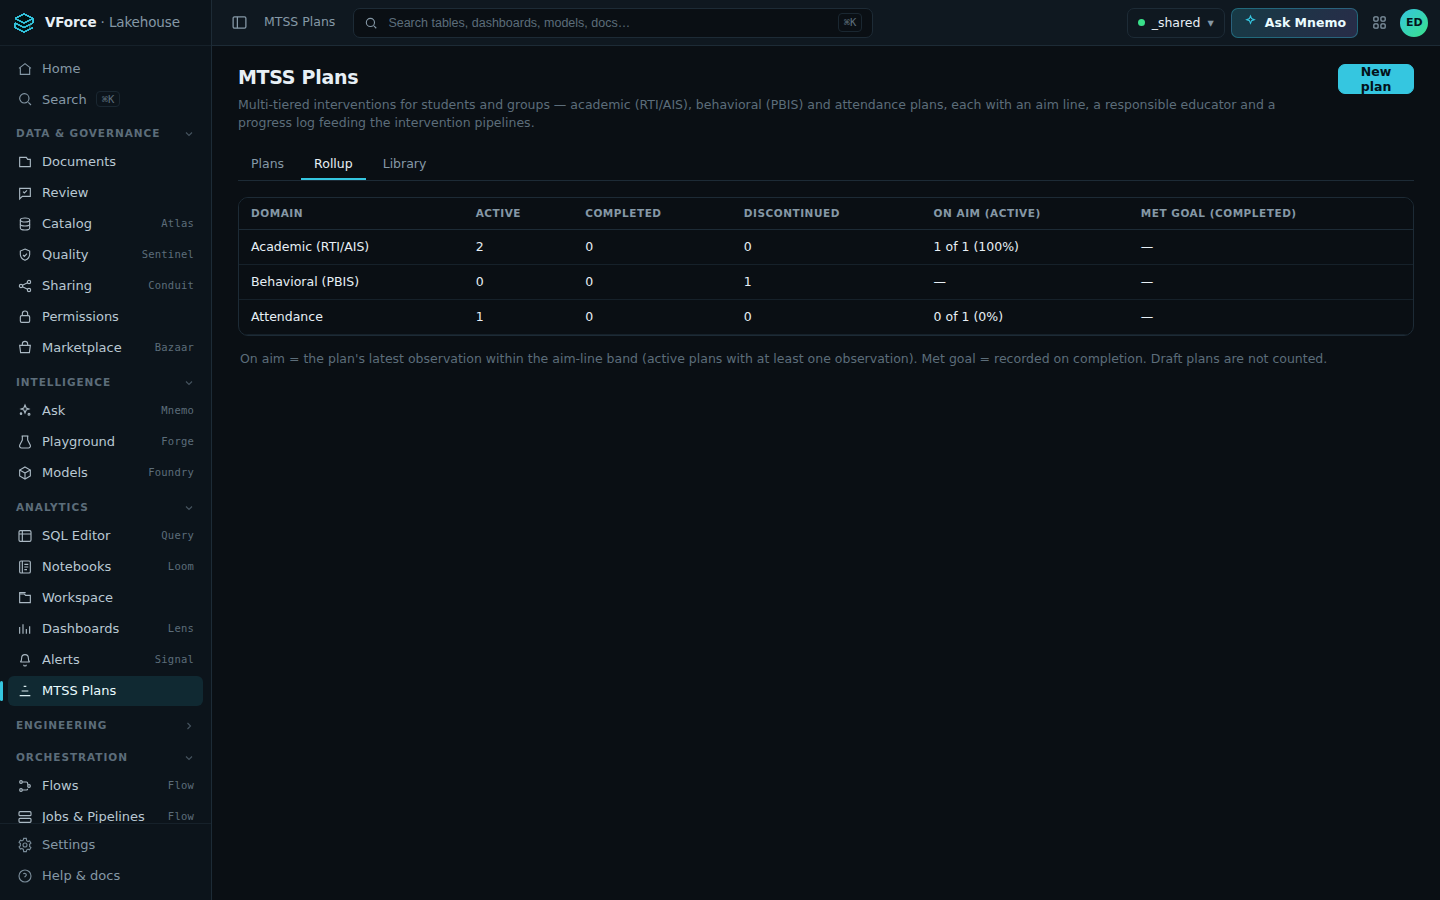
The school-level rollup: counts, %-on-aim and %-met-goal by domain — click the image to view full size.